
TR Ultra Growth Newsletter AI Game Plan 2026

Happy New Year!
No, I did not fall overboard on our 2-week EU river cruise in December — but the severe flu I caught somewhere in Vienna, Austria, DID knock me out for a good ten days mid-January. Then our Wealth Management Assets Under Management exploded 5X through appreciation and with new accounts opened from November through late January 26.
We were swamped and working 7 days a week to catch up, which we have done. But all in all, I owe our paid subscribers an apology and explanation of why we did not get out our normal newsletters after in December/January of what I have now come to call “The Secular Global Super Cycle Sectors” that I hope has made you close 30 years of wealth in the last 2 years or 2-3X your portfolio value exploding since 2024.
Hyperbole? Our original TR Ultra Growth AI Data Center Technology portfolio (which, in our Sept/October NL, we encouraged you to take profits in) plus our leveraged Gold and Silver Miners (until last week!) have returned over 650% in the last 24 months — 6.5X your investment.
We have been using those profits to fund NEW SuperCycle Sectors of the Global Economy (ESPECIALLY 3X Leveraged Silver & Gold Miners ETF picks) that we shared in our September 2025 newsletter.
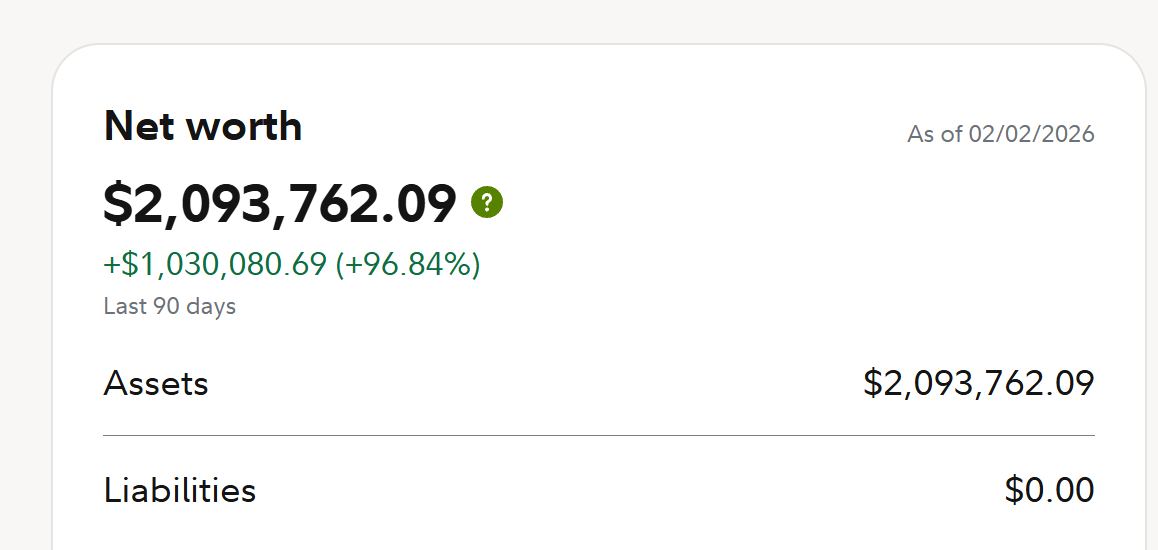
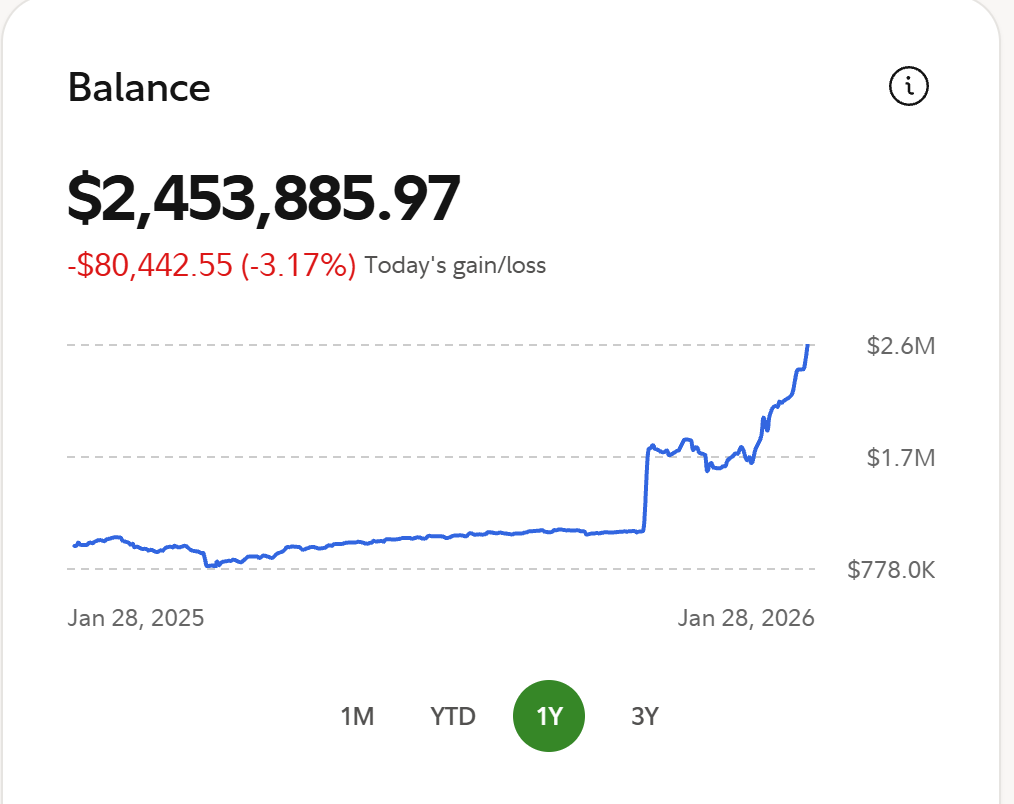
Here’s an example of a pretty amazing example of new wealth earned for a new client of TR Wealth Management LLC that started with us 120 days ago, early October 2025
Yes, and those numbers include last Friday’s silver and gold crash.
Key Point:- If you are ready to let us run some or all of your stock market wealth, text Marjorie Sutherland-Smith at 301 520-9610 or email her at marjorie6116@gmail.com, and she will book you for a Zoom call (Or Apple Video Chat) starting next week.
$1M minimum account--but for long-time subscribers of mine--like 25 years!!!--we can live with $500,000 or more.
Note: If you are ready to have us manage some or all of your various portfolios--we, are adding 10 additional management clients ($minimum $1 million UNLESS you are a long-time subscriber from my ChangeWave Investing days!)
WARNING: I am in NO WAY promising you that TR Wealth Management LLC and our Ultra Growth portfolios will turn $928,000 in early October into $2.6 million in 4 months of course. But our managed portfolios HAVE outperformed the S&P 500 10X over the last 3 years!
But I would love to see some images of TR Ultra Growth subscribers who have beaten this performance — I know there are!
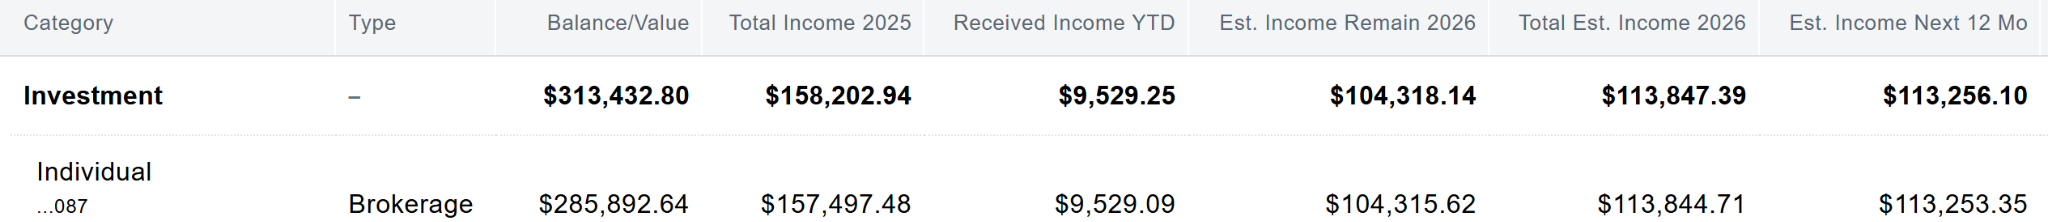
We also run our 6%-to-8% Per MONTH Income Portfolio — I call this portfolio “The OTHER Social Security” pension plan. Here is a $313,000 Ultra Monthly Income Account we manage for a retired friend of mine (this does not include $35,000 in 2025 she earned with a private placement secured note she holds outside this account).
Process: YOU tell us how much monthly income you want (AFTER TAX), and we build and run the portfolio--you get the monthly cash. Again--if you are interested in this kind of monthly income, text Marjorie Sutherland-Smith at 301 412-8622 or email at marjorie6116@gmail.com and she will book you for a Zoom call (Or Apple Video Chat) starting next week.
Back to How We Got So Backed Up
Like all US-based equity research firms with an ever-growing wealth management business, what has been overwhelming every day since September 2025 has been the gigantic 24/7/365 daily scale of
The daily deluge of radical US Foreign and Federal Government policy destruction
The emergence of what is now referred to as the “Donroe Doctrine,” where the US government, led by you know who, renditions “enemies of the State” and bombs, and attacked the following countries just in the last six months (see below)
The glide path of tax cuts and $2.8 trillion of deficit spending in fiscal 2025 and 2026
All of which has created what I have come to call
The 24/7/365 “TMIUEQ” aka nuclear powered DAILY uncertainty about VITALLY important aspects of the US/EU and modern world economies, which, as you know,
The US equity/bond/precious metal markets are NOT able to digest such 24/7/365
OK BUT WTF REALLY Caused the Silver/Gold Crash Last Friday??
Monday was a fascinating morning in silver — a classic violent rebound off an equally violent selloff just days ago. Here's the context behind it:
The Move This Week
Silver is at $88.10 per ounce as of 8:15 a.m. ET today, up $6.43 from yesterday. That's up 9.62% from the previous day, and our silver trade from early September is STILL roughly 171% compared to the same time last year.
Silver futures with settlement in March 2026 gained more than 15% on COMEX, with the precious metal price surging by 15.05% to $88.6 per troy ounce, then accelerating to $89.1 per troy ounce, up 15.7%. The current price of silver futures is around $88-$89 USD per ounce — it has risen 9.92% in the past 24 hours. TradingView (This appears to be slightly older data, as TASS shows the more recent surge to the $88-89 range.)
Context on Silver Move
For those of us who have been around through many precious metal melt-ups and meltdowns, this was just a violent snapback rally off a historic collapse, as traders reassess their positions after the massive OVERCROWDED TRADE selloff.
What Drove The Meltdown
As the January 28% meltdown was a classic over crowded, margin-call, forced-selling event, and yesterday and today again saw a classic short-covering (aka profit-taking) event, plus dip-buying after an extreme washout. Remember, silver hit a record above $120 last Thursday, then crashed 26% in a single day — the largest one-day drop on record.
The move back up this week is essentially the market saying, "we overshot to the downside," combined with technical buyers and potentially some of those Chinese speculators who unwound positions and are now coming back in.
The move is being amplified by COMEX's relatively thin liquidity compared to larger markets. Markets such as silver are a fraction of the size of gold or major equity benchmarks, meaning the influx of speculative capital is having an outsized impact on prices.
Key point: REMEMBER--NOTHING CHANGED in our silver investment thesis--the world has 3-to-1 MORE DEMAND than supply for silver required in AI Data Centers and other industrial applications.
Again, as electricity demand accelerates rapidly, Artificial intelligence is expected to increase energy demand by up to 8,000% by the 2030s1. Data centers alone could consume as much electricity as small countries like Sweden or Argentina.
Dead Cat Bounce or New Leg Up?
The reason silver is surging is that... it got absolutely obliterated last week--did ya notice?
Silver had hit a record high above $120 on Thursday of last week, and then on January 30th, it plunged a record 26% — its largest one-day drop on record — after reports that Trump plans to nominate Kevin Warsh as the next Federal Reserve chair, a move widely seen as signaling a more hawkish policy stance.
The selloff was triggered by a combination of factors, including a rebound in the U.S. dollar, and then the decline was exacerbated by a rapid unwind of speculative positions among Chinese investors. TRADING ECONOMICS
Is the floor in, or is this the proverbial dead cat bounce or, more charitably, a reassessment by the market that the selloff overshot?
Given the massive supply and demand imbalance globally-- our strong advice is “THIS ain’t no dead cat bounce.”
Why Analysts Think the Selloff Was Overdone
Deutsche Bank/Goldman/JP Morgan all came out and said the broader investment case for gold and silver remains intact, noting that "the adjustment in precious metal prices overshot the significance of its ostensible catalysts" and that "investor intentions in precious (official, institutional, individual) have not likely changed for the worse." CNBC
Barclays struck a similar tone, acknowledging overheated technicals and stretched positioning, but said the broader "bid" for gold and silver WILL remain resilient amid geopolitical and policy uncertainties and reserve-diversification themes.
The Structural Story Underneath Hasn't Changed
This is the part that ties directly into the themes we have been tracking — the AI infrastructure buildout, solar, and industrial demand:
A study published in January projected that global silver demand will surge this decade, driven largely by solar photovoltaics and the shift to more silver-intensive cell technologies. Total demand is forecast to reach 48,000 to 54,000 tonnes a year by 2030, while supply is expected to rise only to about 34,000 tonnes — meaning just 62–70% of demand would be met. The solar sector alone is projected to consume 10,000–14,000 tonnes annually, representing up to 41% of global supply. CNBC
Industrial uses such as solar, EVs, electronics, and AI Data Center hardware wiring now account for over half of global silver demand. GoldSilver, and that is a SECULAR NOT CYCLICAL structural deficit that underpins the bull case, regardless of near-term speculative whipsaws.
I repeat: GLOBAL Artificial intelligence data center build-outs are expected to increase GLOBAL energy demand by up to 8,000% by the 2030s.
The Key Tension Right Now
The market is caught between two narratives. Bears see a mania chart destined to crater, while bulls see a secular shortage with years left to run. Remember — markets like silver are a fraction of the size of gold or major equity benchmarks, meaning the recent influx of speculative capital is having an outsized impact on prices, which explains both the January meltup to $120 and the 26% one-day crash.
The Warsh/Fed hawkishness catalyst and the Chinese speculative unwind are the proximate causes of the volatility. But the underlying supply deficit story—especially with data center buildouts, solar, and EVs consuming silver at accelerating rates—is what keeps the market coming back to bid the dips!
ALL you really need to understand on silver and gold--but especially silver--is the difference between the "All In" cost per ounce of silver or gold in the ground and the prices miners can sell their silver and gold (and copper too).
AISC = All-In Sustaining Cost
As part of efforts to standardize gold cost reporting, the World Gold Council (WGC) introduced the All-In Sustaining Cost (AISC) in 2013 to enhance transparency. The AISC is, simply, the full cost associated with producing one ounce of gold. Mtech
What AISC Includes:
AISC = (Direct production costs + Corporate G&A + Exploration and evaluation costs + Capital expenditures for sustaining operations) / Total ounces of gold produced Kapitales
Breakdown:
Direct production costs - Labor, fuel, energy, materials for mining
Corporate G&A (General & Administrative) - Salaries, legal fees, admin expenses
Exploration and evaluation costs - Finding new deposits and evaluating potential
Sustaining capital expenditures - Equipment replacement, maintenance, mine restoration, waste disposal
Reclamation costs - Restoring the mine site after closure
Why AISC Replaced "Cash Cost":
The truth was simply that the other costs omitted in the traditional cash costs promoted the past decades by the industry. As a result, even when the gold price was high, nearly $1900 per ounce in August 2011, gold producers were not reporting excessive profits in their cash flow / income statements, to the disappointment and incomprehension of investors. Mtech
The old "cash cost" metric only included direct mining and processing costs but excluded critical expenses like:
Administrative overhead
Sustaining capital (equipment replacement)
Exploration
Site reclamation/closure costs
This made mines look profitable on paper when they actually weren't covering their true ongoing costs.
Current AISC Levels (2025/2026):
AISC rose to US$1,456/oz (up 4% q/q and 9% y/y), the highest point in our data series back to Q1'10. World Gold Council
For silver, recent data shows: Consolidated attributable cash costs and all-in sustaining costs for 2024 were $17.41 per silver ounce and $28.13 per silver ounce, respectively. Americas-gold
Why AISC Matters to You as an Investor:
AISC represents the "floor price" below which mining becomes unprofitable.
When spot prices fall below AISC:
Mines shut down or curtail production
Supply tightens
Prices eventually rise (supply/demand rebalancing)
When spot prices significantly exceed AISC:
Mines expand production
New projects become economic
Supply increases
Current Context (Feb 2026):
Gold:
Spot price: ~$5,500/oz
AISC: ~$1,456/oz
Margin: $4,044/oz (276% above cost!) — Extremely profitable
Silver:
Spot price: ~$86-89/oz (after recent volatility)
AISC: ~$28/oz
Margin: $58-61/oz (207-217% above cost!) — Also highly profitable
This is why mining stocks have been showing such strong leverage during the precious metals rally. When AISC is $28/oz and silver trades at $120/oz (at the peak), miners were making $92/oz profit — a 328% margin!. AISC (All-In Sustaining Cost) is the mining industry's comprehensive cost basis metric for gold, silver, and other precious metals, standardized by the World Gold Council in 2013.
NOW THE BIG PICTURE for the US Stock Market in 2026
The 2026 Market + TMIUDEQ
TMIUDEQ is my shorthand for the state of the world and the US Stock Market today:
1) TOO Many Massively Important Yet 2) UNanswerable 3) Economic/Foreign Policy Questions of the United States Government that now hit the wires 24/7/365 in 2026 and will for the foreseeable future.
My bet in your busy lives--working or retired--it is EXTREMELY difficult (ok impossible) to keep up with all the massively important NEW or CANCELLED daily economic and foreign policy decisions that are made 24/7 and broadcast to the world 24/7 from White House Oval Office/ Press Room/Truth Social/X all of which crash into the US and Globally important financial markets 24/7/365 directly from the current Executive Branch of US Federal Government.
Really Key Point: ALL of the facts presented below are 100% unprecedented, i.e., THEY NEVER ALL HAPPENED AT THE SAME TIME BEFORE, let alone on an hourly/daily/weekly basis. Add them all up — and together they tell a heretofore unrecognisable global and North American political and economic story (and why my gray hair is getting much lighter!).
What do I mean by UNPRECEDENTED??
Here’s Our Scorecard of Trumponomics 2026: Let’s Start with Foreign Countries Attacked and Bombed by the United States in the Last 12 Months, while NOT IN a Declared War:
1. Venezuela (September 2025 - January 2026)
Since September 2025, the US has struck more than 30 vessels in the Caribbean that it alleges were trafficking drugs Al Jazeera
At least 117 people have been killed in 36 strikes on 37 vessels Wikipedia
In late December, struck a land target (docking facility) inside Venezuela
January 3, 2026: Launched a major operation that extracted President Maduro from Caracas
2. Syria (Ongoing through January 2026)
US forces had conducted almost eighty operations against ISIS in Syria in the six months prior to January 2026, killing fourteen militants, Council on Foreign Relations
On January 10, 2026, U.S. forces expanded the operation, striking thirty-five ISIS targets, including weapons caches and supply routes, Council on Foreign Relations
3. Somalia (Ongoing)
Reports suggest at least 111 strikes occurred in 2025, marking a spike compared to previous years, The Sunday Guardian
Targeted al-Shabaab and ISIS-Somalia
4. Yemen (January - May 2025)
Operation "Rough Rider" against Houthi positions
Ended in May 2025 following an Oman-brokered ceasefire
5. Nigeria (December 2025)
On Christmas night, the U.S. launched strikes on ISIS-linked military forces in coordination with the Nigerian government in Sokoto State in northwestern Nigeria Fox News
6. Iraq (Ongoing)
Continued counterterrorism operations against ISIS
7. Iran (June 2025)
Operation "Midnight Hammer" - major strike on three nuclear sites using B-2 stealth bombers and bunker-buster bombs
Total Scale: Armed Conflict Location & Event Data or ACLED reported that the US had carried out – or been a partner to – 622 overseas bombings in all, using drones or aircraft, since January 20, 2025 Al Jazeera.
Key Point: Does the above data NOW MAKE the 535% rise in the SAFE HAVEN valuations of our leveraged silver and gold ETF plays AGQ and GDXU/JNUG/SILJSLJY from mid-September make sense: when major investors and sovereign wealth funds and central banks are scared out of their wits--they buy thousands of tons of gold.
Point #2 The Historic Devaluation of the US $Dollar Against Major Countries Forces Major Central Banks to SELL $Dollar Denominated ASSETS & Massively INCREASE Their Holdings of Substitute Assets, which APPRECIATE When The Dollar Gets Massively Depreciated in Value vs. Gold
How much has the US dollar depreciated against “haven assets” like gold bullion
US Dollar vs Gold: MASSIVE DEPRECIATION
Approximately 75% decline
Gold prices tell the story:
Gold was $2,623.91 per ounce on January 1, 2025 Exchange Rates
Current gold price is around $4,595-4,615 per ounce (as of late January 2026)
Over the past year, XAU/USD has changed by 70.09% Investing.com
This represents gold's fourth strongest annual return since 1971 and one of the most dramatic precious metals rallies in modern history. The decline followed a sharp rally that pushed bullion to a record $5,608 on Thursday, TRADING ECONOMICS, before a major pullback.
Key drivers: Heightened geopolitical uncertainty, sustained US dollar weakness, central bank buying, and safe-haven demand (which is retruning as I type this).
US Dollar vs Euro: SIGNIFICANT DEPRECIATION
Approximately 13.3% decline
EUR/USD started 2025 around 1.04
The euro settled at $1.19 at the end of January, close to a four-year high and marking a 1.5% gain over the month TRADING ECONOMICS
The EUR/USD rate is up +13.34% in 2025 Exchange Rates
The dollar fell from around 1.04 EUR/USD at the start of 2025 to approximately 1.19 by late January 2026, meaning the Euro strengthened significantly against the dollar.
Key drivers: The US dollar depreciated by 9.4% (DXY basis) in 2025, and we expect that depreciation to extend further this year. MUFG Research: policy uncertainty in Washington, Trump's tariff threats, and lingering criticism of Fed independence, even with the new Chairman appointee, Tom Walsh.
Federal Government Fiscal Year 2025 (Ended September 30, 2025)
Federal Deficit: $1.8 trillion Congressional Budget Office
Government Borrowing: $1.8 trillion (the deficit equals the amount borrowed)
Key Details:
The federal deficit in 2025 was equal to 5.9 percent of the nation's gross domestic product (GDP) Congressional Budget Office
As of September 30, 2025, the federal debt was $37.6 trillion—up $2.2 trillion from FY 2024 U.S. GAO
Federal debt held by the public increased in 2025 relative to the size of the economy—rising to 99.8 percent from 97.4 percent of GDP at the end of fiscal year 2024 Congressional Budget Office
Interest on the debt in FY 2025 increased to $1.2 trillion U.S. GAO (surpassing $1 trillion for the first time)
Fiscal Year 2026 Projections (Ending September 30, 2026)
Without the One Big Beautiful Bill Act (OBBBA): The CBO projected (before OBBBA passage) deficits of approximately $1.9 trillion
With OBBBA (enacted July 2025): The deficit impact is significantly larger due to major tax cuts:
The recently enacted One Big Beautiful Bill Act (OBBBA) will increase borrowing by $4.1 trillion through 2034 on a conventional basis Committee for a Responsible Federal Budget For FY 2026 specifically: We estimate that while OBBBA slightly decreased the FY 2025 deficit – largely as a result of the savings logged from its student loan changes – it will add $500 billion to the deficit in 2026, $635 billion in 2027 Committee for a Responsible Federal Budget
This means the FY 2026 deficit is projected at approximately $2.4 trillion (baseline ~$1.9T + $500B from OBBBA)
What the OBBBA Contains (Tax Cuts Hitting 2026):
The law includes massive tax cuts:
$3.9 trillion to extend and expand the expiring individual TCJA tax changes Committee for a Responsible Federal Budget
$1.1 trillion to enact new and renewed business tax breaks – especially full expensing of equipment, research, and factories Committee for a Responsible Federal Budget
More than $400 billion on the individual side, largely for temporary tax breaks discussed on the campaign trail – including tax breaks for tips, overtime, and senior income Committee for a Responsible Federal Budget
Total over 10 years: $5.9 trillion of tax cuts and spending increases, $2.5 trillion of tax offsets, and over $700 billion of additional interest costs per year Committee for a Responsible Federal Budget
Key Question: IF the Federal Government has to BORROW $2 trillion a year to finance the OBBA tax cuts for 3 more years--what is the plan to INCREASE Federal Government INCOME? Tariffs? According to latest GDP data--US manufacturing
Long-Term Trajectory:
Administration's optimistic view: OMB now estimates that budget deficits will total $15.7 trillion over the FY 2026–2035 budget window American Action Forum (they claim significant savings from tariffs and spending cuts)
Independent analysis: Tax Foundation modeling indicates the One Big Beautiful Bill Act (OBBBA) will boost economic growth but increase deficits, leading to record high debt in 2028 that rises to 124 percent of GDP by 2034 Tax Foundation
Baseline Federal Interest Payments BEFORE OBBA Was Passed
Net interest payments under the baseline (before OBBBA) were projected to rise from $881 billion in FY 2024 to $952 billion in 2025, then to $1 trillion in FY 2026, before climbing further to nearly $1.8 trillion in 2035. Committee for a Responsible Federal Budget
More specifically for the years:
FY 2026: ~$1.0 trillion (3.2% of GDP)
FY 2027: ~$1.1 trillion
FY 2028: ~$1.2 trillion
CBO projects that net interest payments will total $13.8 trillion over the next decade (2026-2035), rising from an annual cost of $1.0 trillion in 2026 to $1.8 trillion in 2035. Peterson Foundation
How Much WILL THE Federal Government Have to Borrow Due to OBBBA (2026-2029)?
CBO estimates that the OBBBA legislation will add $3.4 trillion to the primary deficit through 2034. With interest, the bill would increase borrowing by $4.1 trillion. Committee for a Responsible Federal Budget
The House-passed bill includes roughly $5.3 trillion of tax cuts and spending partially offset by $2.9 trillion of revenue increases and spending cuts. As written, OBBBA's largest deficit impact would be in 2027, increasing the primary deficit that year by over $500 billion. Committee for a Responsible Federal Budget
The borrowing is heavily front-loaded:
FY 2026: Deficit increases to 7.0% of GDP (from a baseline of 5.5%)
FY 2027: Primary deficit increases by over $500 billion (the peak year)
FY 2028: Primary deficit increases by ~$400+ billion
FY 2029: Deficits begin to moderate slightly but remain elevated
Nearly three-quarters of the official primary deficit impact would be in the first four years. Committee for a Responsible Federal Budget
Additional Interest Costs on Total Federal Debt (2026-2028)
This is where the compounding effect becomes brutal: A meaningful portion of the additional borrowing is due to higher interest costs. Under OBBBA, interest on the debt would double from nearly $900 billion in 2024 to $1.8 trillion (4.2 percent of GDP) by 2034. Committee for a Responsible Federal Budget
Because the Senate bill would add about $3.4 trillion to primary deficits, it would increase interest costs by more than $700 billion over the next decade. Committee for a Responsible Federal Budget
More specifically, on additional interest:
The additional annual interest payments from OBBBA-driven borrowing amount to roughly $700+ billion over the 10-year period, with the incremental interest costs rising each year as the additional debt compounds.
For the specific years you asked about:
FY 2026: Additional interest of ~$30-50 billion (early-stage impact)
FY 2027: Additional interest of ~$80-100 billion (compounding accelerates)
FY 2028: Additional interest of ~$100-130 billion (full compounding in effect)
By 2034, the incremental annual interest on OBBBA borrowing alone would be in the $150-$200 billion range.
The Bigger Picture
By 2054, the 10-year Treasury yield is 1.2 percentage points higher than it would have been if the bill were not passed. By the third decade, the deficit is higher by almost 3 percentage points of GDP. The increase in net interest outlays accounts for nearly two-thirds of the deficit increase in the third decade. The Budget Lab at Yale
If interest rates remain elevated at current levels – with 10-year Treasuries at 4.5 percent – then interest costs would climb further to $2.1 trillion (5.1 percent of GDP) in 2034 or $2.2 trillion (5.2 percent of GDP) under a permanent OBBBA scenario. Committee for a Responsible Federal Budget
The US Federal Government DEBT SPIRAL NO Republican or Dem Wants to Talk About
The critical dynamic here is that OBBBA creates a debt spiral: additional borrowing generates additional interest, which requires additional borrowing, which generates more interest. This is why interest costs become such a dominant portion of the deficit in later years — the compounding is relentless.
Summary:
FY 2025: $1.8 trillion deficit, $1.8 trillion borrowed
FY 2026 (projected): ~$2.4 trillion deficit (including OBBBA impact), ~$2.4 trillion borrowing
Total debt: Now at $37.6 trillion (99.8% of GDP)
OBBBA impact: Adds $500 billion to FY 2026 deficit, $4.1 trillion over decade with interest
Interest costs: Exceeded $1 trillion annually for the first time in FY 2025
The tax cuts in OBBBA are front-loaded, meaning their largest impact on revenues (and thus the deficit) hits in 2026-2027, with some provisions expiring in 2028-2029.
FY 2025: $1.8 trillion deficit, $1.8 trillion borrowed
FY 2026 (projected): ~$2.4 trillion deficit (including OBBBA impact), ~$2.4 trillion borrowing
Total debt: Now at $37.6 trillion (99.8% of GDP)
OBBBA impact: Adds $500 billion to FY 2026 deficit, $4.1 trillion over decade with interest
Interest costs: Exceeded $1 trillion annually for first time in FY 2025
Conclusion: YO--THERE IS NO PAST PLAYBOOK FOR THIS SCALE OF Financial & US Foreign Policy Transformation + Disruption, OK?
But What REALLY Started the Silver Crash (before margined accounts got cleaned out)
The China ‘Zombie Bank’ Exodus
Silver spot prices touched a record of $110.1250 intraday before stabilizing near $109.69, capping a frantic rally that has seen the metal double in under three months.
According to Rose AI founder Alexander Campbell, the primary engine of this latest leg up is capital flight from China. Campbell describes a “zombie banking system” laden with trillions in hidden losses, forcing Chinese households to choose between technically insolvent bank deposits or physical assets.
“The secret is out that property is not a safe store of wealth,” Campbell wrote in his Jan. 26 update. “You only need a tiny shift in savings behavior to break the silver market”. This panic buying has created a massive arbitrage gap, says Campbell, as silver in Shanghai is trading at a structural premium to COMEX prices.
Profit Taking Vs. Panic Buying
Despite the caution, the floor remains high. With solar and AI demand creating an inelastic deficit and COMEX inventories on pace to be exhausted by September, the squeeze shows few signs of abating.
“The dynamics that got us here haven't changed,” Campbell noted. “They've accelerated”.
Here’s a list of some silver and silver mining stocks-linked ETFs --and of course our 2x-3X leveraged silver and gold miner ETFs have 2X-3X these returns.
| Silver and Silver Miner ETFs | 6-Month Performance | YTD Performance | One Year Performance |
|---|---|---|---|
| iShares Silver Trust (NYSE:SLV) | 168.22% | 41.31% | 238.35% |
| abrdn Physical Silver Shares ETF (NYSE:SIVR) | 168.41% | 41.30% | 238.56% |
| Global X Silver Miners ETF (NYSE:SIL) | 127.63% | 34.39% | 240.33% |
| Amplify Junior Silver Miners ETF (NYSE:SILJ) | 155.88% | 41.13% | 274.66% |
Note: the sell off in Silver at record prices is what is called a “Margin Call” --let me explain.
The Silver meltdown last Friday is a GIANT margin call -- call it a "Silver Margin Meltdown" as silver was overbought on RSI for weeks...IF you don't have a position...let's assume Friday was the first leg of the washout-- add a bit more today and tomorrow . . the late-to-the party speculators washed out on margin calls . . .
Understanding the CME & COMEX Silver Futures
The CME (specifically COMEX, which is the metals division of CME Group) is where silver futures contracts are traded, not physical silver itself.
Futures contracts are derivatives: When you trade silver on COMEX, you're trading standardized contracts that represent a commitment to deliver (or take delivery of) silver at a future date. The standard COMEX silver futures contract represents 5,000 ounces of silver.
Mostly cash-settled: The vast majority of these futures contracts (estimates suggest 95%+ ) are closed out before expiration and never result in physical delivery. Traders are speculating on price movements or hedging risk, not actually buying or receiving silver bars.
Physical delivery is possible but rare: COMEX does maintain registered vaults with physical silver that can be delivered against contracts, but only a small fraction of contracts actually go to delivery. When they do, the silver must meet specific purity and form requirements (1,000-ounce bars at .999 fineness).
The "Paper to Physical" Ratio Issue
This is precisely what created market tensions during silver's 2025-2026 rally. Some estimates placed the paper-to-physical ratio at a staggering 356:1, meaning there were 356 ounces of "paper silver" traded for every one ounce of physical silver held in registered vaults FinancialContent.
This massive leverage is why the CME margin hikes were so significant—they forced deleveraging in the paper market, where the vast majority of speculative activity occurs.
Major Recent Margin Changes Methodology shift (January 13, 2026):
The CME made a fundamental change in how it sets margins for precious metals, moving from fixed-dollar amounts to a percentage-based system. Silver margins were set at 9% of contract value with gold at 5% and palladium at 11%. This percentage-based approach was designed as a self-adjusting "speed limit" that automatically scales with price movements, eliminating the need for frequent manual adjustments that had characterized late 2025.
The December 2025 - Early January 2026 Wave Prior to the methodology change, the CME implemented multiple dramatic margin hikes: December 26, 2025: Maintenance margin increased from approximately $22,000 to $25,000 per contract (13.6% increase) December 30, 2025: Another 30% increase brought the total initial margin requirement to $32,500 per 5,000-ounce contract
These moves came as silver surged to record territory, with prices reaching an intraday peak of $84.01 per ounce on December 29, 2025.
Current Status: The percentage-based system implemented on January 13 means margins now automatically adjust with silver's price movements rather than requiring discrete announcements. At 9% of contract value, if silver is trading around $70-75/oz currently, that would put margins at roughly $31,500-$33,750 per standard 5,000-ounce contract—without requiring new CME announcements for each price fluctuation. Last Friday, the physical silver speculators got MARGIN CALLS--$billions
Listen to The Wisdom of Jim Grant
My friend Jim Grant famously stated years ago that "gold's perceived value in US dollar terms is the reciprocal of confidence in the Fed and/or the US economy." An earlier formulation was: "Gold's price is the reciprocal of faith in central banks."
What This Means:
This elegant observation captures a fundamental relationship:
When confidence in the Federal Reserve declines → gold prices rise
When confidence in the US economy weakens → gold prices strengthen
When faith in central bank competence diminishes → gold value increases
It's an inverse relationship - gold acts as a referendum on monetary policy credibility and economic stability.
On Gold's Rise: Grant suggested gold's rally reflects "some element of the world getting tired of America's value proposition" - specifically, the bond value proposition. He noted it's possible the world has decided that:
America's external debt is "insupportable."
The US fiscal posture is "a scandal."
The dollar's days as reserve currency are "numbered."
It is impossible for me to argue on US Fiscal Position: Grant stated he's thought "for decades and decades that the United States was on a path to fiscal ruin," and rising interest rates despite Fed cuts might signal the market's concern about America's fiscal trajectory.
The Six Key Fundamentals (Grant's Framework):
Based on Grant's observation, analysts have identified gold's "true fundamentals" as measures of confidence:
Real interest rates (inflation-adjusted yields)
Yield curve (shape of the Treasury curve)
Credit spreads (corporate vs. Treasury yields)
Banking sector relative strength
US dollar exchange rate
Commodity prices (general inflation expectations)
Why This Matters Now:
Grant's framework is particularly relevant given:
Gold hitting all-time highs around $5,600/oz (up 86% in 2025-26)
Persistent US fiscal deficits (debt-to-GDP at 120-125%)
Federal Government’s $38 TRILLION Debt growing $1-$2 trillion a year
Central bank gold buying at record levels (until very recently)
De-dollarization trends accelerating
Fed credibility questions amid inflation volatility
But here is where the rubber meets the proverbial road:
US GDP in 2025
Based on the latest Bureau of Economic Analysis data: Nominal GDP (Q3 2025): $31.1 trillion (seasonally adjusted annual rate)
Real GDP growth in Q3 2025: 4.4% annualized rate
Q2 2025: Real GDP grew 3.8%
Q1 2025: Real GDP declined -0.6%
Full Year 2025 Estimates:
EY-Parthenon forecasts average GDP growth of 2.3% for 2025 as a whole
Expected Q4 2025 growth: 3.2% (EY) to 5.4% (Atlanta Fed GDPNow model)
Strong performance driven by consumer spending (3.5%), AI-related investment, and robust exports
Federal Debt by End of Fiscal Year 2026
Current Debt Position (as of Feb 4, 2026):
Total Gross National Debt: $38.43 trillion
Debt held by the public: $30.81 trillion
Intragovernmental holdings: $7.62 trillion
FY2025 Year-End (September 30, 2025):
Total federal debt: $37.6 trillion (per GAO audit)
Debt increased $2.2 trillion during FY2025
Debt-to-GDP ratio: 99.8%
FY2026 Projections (ending September 30, 2026):
Based on current trajectory and CBO projections:
Estimated Total Federal Debt by End of FY2026: ~$39.5-40.0 trillion
Here's the breakdown:
Current deficit pace: $601 billion in first 3 months (Oct-Dec 2025)
CBO projected FY2026 deficit: $1.7 trillion (5.5% of GDP)
Daily debt increase rate: Currently averaging $8.03 billion per day
At this rate, debt will hit $39 trillion by approximately April 5, 2026
Projected Debt-to-GDP Ratio by End FY2026:
White House CEA (optimistic): 97% of GDP
CRFB Adjusted Baseline (realistic): ~100-101% of GDP
Key Context on the Fiscal Situation:
Interest Costs (FY2026):
Interest payments on debt: $1.2 trillion in FY2025 (up from $345 billion in 2020)
Projected to exceed $1 trillion annually going forward
Interest costs now 3.2% of GDP in 2026 (eclipsing 1991 peak)
Second-largest federal spending category after Social Security
The Math:
Debt per person: $112,966
Debt per household: $285,127
Average interest rate on marketable debt: 3.362% (December 2025)
Bottom Line: The US ended 2025 with a nominal GDP of approximately $31.1 trillion and total federal debt of $37.6 trillion (FY2025 end).
But oh, it gets worse. On September 30, 2026 (end of FY2026), federal debt is projected to reach approximately $39.5-40 trillion, representing roughly 125-129% of GDP when comparing total gross debt to GDP, or about 100% of GDP when measuring debt held by the public only.
Key Point: ALL the above means the total federal debt is now significantly larger than annual GDP - a milestone that underscores Jim Grant's concerns about America's fiscal trajectory mentioned earlier.
The Bottom Line: Grant's "reciprocal" observation remains, to me, the most intellectually elegant explanation for gold's role as a monetary asset: it rises not because of its own intrinsic qualities, but as a mathematical inverse of declining faith in the alternatives (fiat currency and central bank management).
This analysis also is the core of the books investment thesis: that as LONG as the Executive Branch of the American Democracy creates DAILY REALITY SHOW TV Episodes and the daily DESECRATION of attacks on 60 years+ of norms for economic and political behavior from American post-WWII--the pillars of the post WWII international economic relationships will continue to weaken and aid the secular decline in America's dominant role in the world economy and decline of valued relationships that serve to "keep the wheels of global democracies turning."
Action To Take: Our New DAILY Investing Service Coming Soon
We started the Transformity Discord Trading room two years to attempt to have a daily real time conversation and explanation about things happening in the equity markets/economy/government to try to make sense of what I have come to call “Trumponomics” and posting short term trades in the sectors of the economy and stock market that regardless of Trumponomics are in secular “SuperCycles” of 3-5 year growth cycles.
These Are The SuperCycles related to the AI Revolution (Assuming Mckinsey Estimate of $6.7 TRILLION of global AI Data Center Spend to 2030
Best Estimate: $6.7- Trillion Through 2030 (McKinsey Authoritative Forecast)
McKinsey Base Case (Most Cited & Comprehensive):
Our research shows that by 2030, data centers are projected to require $6.7 trillion worldwide to keep pace with the demand for compute power. Data centers equipped to handle AI processing loads are projected to require $5.2 trillion in capital expenditures, while those powering traditional IT applications are projected to require $1.5 trillion in capital expenditures. McKinsey & Company
Breakdown of the $6.7 Trillion:
AI-ready data centers: $5.2 trillion
Traditional IT data centers: $1.5 trillion
AI Data Center Construction
Neocloud AI Data Processing Rental Centers
“Behind the Meter” On-Site Electrical Power Generation
Off-Grid Power Generation Fuels
AI Data Center Computing Chips & Systems
AI Data Center Optical Networking
AI High Bandwidth Memory Processing & Storage
CPU/GPU Microchip Foundries
Strategic Minerals & Metals with US Federal Government Supported Minerals & Mining
AI Robotics (“Physical AI”)
Quantum Computing
AI-Based Defense/Drones/EVTOLS & Space-Based AI Data Centers
We generate a LOT of very profitable trading ideas and answer a LOT of questions for subscribers in our Discord Trading Room--but what I found more valuable to our members is ANSWERING questions about the daily complexities not just of trading but keeping one’s confidence as a self-directed investor investing in the most complicated age I have lived in. Key Point: We are going to soon launch a DAILY E-LETTER that summarises ALL the key buy-sell-hold trades--mostly buying and selling options to enhance returns--but also share the links and posts of the day that are most valuable.
We are doing this because obviously, “rate of the rate of change” in Today’s VERY IMPORTANT aspects of stock market strategy, politics, and economics is unprecedented and not slowing down soon. Look for this daily summary roundup information service coming soon….but in the meantime . .
Is My Favorite AI Chatbot Claude from Anthropic Killing Enterprise Software & Slowing Down the AI Data Center Build Out Requiring GPUs/CPUs/TPUs/XPUs and MASSIVE High Bandwidth Memory?
Based on my research, the answer to the current AI Data Center build-out cycle is no.
Will custom Anthropic Code enterprise software reduce revenues for major enterprise software companies? YES--which is why we don’t recommend ANY enterprise software stocks.
Is the projected GLOBAL $8.5 trillion in data center spend overstated?
Probably yes--but again--as the cost of AI data center infrastructure comes DOWN by substitution custom TPUs XPUs and less GPUs--the utility of AI applications go UP while costs come down.
The best way to judge the AI Data Center buildout is to look at TMSC 4-5 year projection of AI data chip production.
TSMC is one of the least sensational management teams in the AI space, yet management explicitly called AI a multi-year “megatrend” in their most recent earnings call, with demand now being pulled not just by chip designers, but directly by hyperscale cloud providers seeking to lock in capacity.
Management stated:
Our customers’ customers, who are mainly the cloud service providers, are also providing strong signals and reaching out directly to request the capacity to support their business. Thus, our conviction in the multiyear AI megatrend remains strong, and we believe the demand for semiconductor will continue to be very fundamental.”
When the world’s most advanced foundry says hyperscalers are coming to them directly for capacity, it signals that AI demand remains foundational. Perhaps most importantly, TSM is not a “flip the switch" business model to where demand can be turned on and turned off quickly. Wafer capacity must be planned years in advance, which makes these signals particularly meaningful.
TSMC already sits beneath tens of trillions of dollars in market capitalization, with customers including Apple, Nvidia, Broadcom, Amazon, AMD, and Google. While each is pursuing AI through a different mix of merchant GPUs, custom silicon, and software, they all converge at the same point: TSMC’s advanced manufacturing. As the roadmap progresses to N2 and A16, customer dependence on TSMC’s leading-edge capacity increases.
The company reported record Q4 revenue of $33.73 billion, up 25.5% year over year and 1.9% sequentially, exceeding the midpoint of guidance by 2.8%. But the more important takeaway was not the quarter, rather it is the visibility that TSMC provides.
Below, we break down how this multi-year AI megatrend translates into durable visibility for TSMC, expands pricing power for advanced nodes, and a longer runway for earnings growth on arguably one of the strongest AI stocks on the bottom-line in the space.
TSMC Raises AI Accelerator Forecast to mid to high 50% CAGR: Evidence of a Multiyear Megatrend
TSMC stands out as the most reliable barometer for tracking AI demand trends. During the Q4 earnings call, management raised the forecast for revenue growth for AI accelerators to a mid- to high 50% CAGR over the 5-year period from 2024 to 2029, up from the mid-40% CAGR provided during the Q4 2024 earnings call. This strongly conveys that AI demand is expanding.
Similarly, the company’s long-term revenue growth forecast was raised to 25% CAGR in U.S. dollar terms for the 5-year period starting from 2024 from the earlier 20% CAGR provided during the Q4 2024 earnings call. Management expects AI accelerators to drive the largest share of incremental revenue growth, while overall growth will continue to be supported by smartphones, high-performance computing (HPC), IoT, and automotive over the next several years.
AI accelerator revenue accounted for a high-teens percentage of total revenue in 2025, up from the mid-teens in 2024. As manufacturing complexity continues to rise, engagement lead times for advanced chips have extended to at least two to three years.
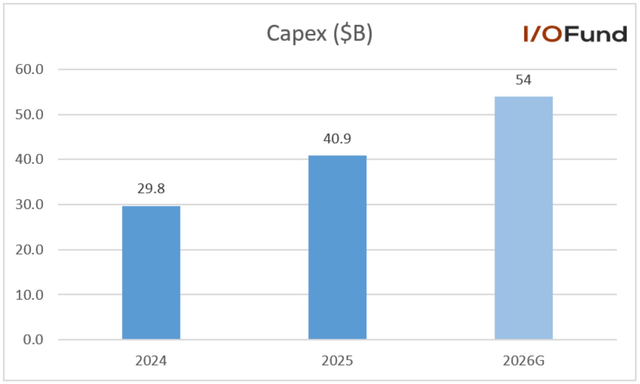
The company’s capex in 2025 grew by 37.4% YoY to $40.9 billion. Management expects 2026 capex in the range of $52 billion to $56 billion, implying a YoY growth of 32% at the midpoint. Notably, 70–80% of 2026 spending will be allocated to advanced process technologies (7nm and below), signaling management’s confidence in sustained, long-term demand driven by AI. TSMC takes two to three years to build a new fab, with the increase in 2026 capex spending, suggests strong growth for the years 2028 and 2029.
Responding to an analyst’s question on whether the industry is in an AI bubble, Chairman and CEO C.C. Wei answered. “Okay. Gokul, you essentially try to ask us, say, whether the AI demand is real or not. I'm also very nervous about it. You bet because we have to invest about USD 52 billion to USD 56 billion for the CapEx, right? If we didn't do it carefully, and that would be big disaster to TSMC for sure.” Management mentioned that they spent $101 billion in capex in the last three years and they expect capex to be significantly higher in the next three years.
et’s use the comprehensive picture of Anthropic's massive AI infrastructure build out to prove TSMC’s 5 year forecast. :
The Scale: Multi-Gigawatt AI Infrastructure
Google Cloud TPU Commitment: Anthropic has secured tens of billions of dollars in data centre infrastructure through Google Cloud, committing to deploy up to one million of its Tensor Processing Units (TPUs) as part of an expansion that will deliver more than 1GW of capacity in 2026. Datacentremagazine
In total, Anthropic will have access to well over a gigawatt of capacity coming online in 2026. This represents the largest expansion of Anthropic's TPU usage to date. Anthropic will have access to up to one million TPU chips. HPCwire
AWS Project Rainier: Amazon Web Services said Project Rainier, the mass-scale data center link-up and unprecedented in-house AI chip deployment to support Anthropic's Claude LLMs, has reached the finish line. With more than 500,000 AWS Trainium 2 chips spread across multiple US data centers, the company plans to increase the number of Trainium chips to one million by the end of the year. DataCenterKnowledge
Total Investment: $95+ Billion in Compute Infrastructure
Anthropic's disclosed funding (~$8B through 2024) falls far short of $95B+ in commitments. The commitment represents multi-year aspiration requiring sustained capital access. Introl
AWS Investment: Amazon has committed $8 billion and is building Project Rainier, which will provide five times more computing power than Anthropic's current largest training cluster. Maginative
Google Investment: Google has invested about $3 billion in Anthropic total. Industry estimates put a 1-gigawatt data center at roughly $50 billion to build, with about $35 billion going to chips. Maginative
New Facilities Announced
Artificial intelligence company Anthropic announced a $50 billion investment in computing infrastructure on Nov. 12 that will include new data centers in Texas and New York. PBS Wisconsin
Multi-Cloud Strategy: The Secret Sauce
Anthropic operates a diversified compute strategy across three chip platforms in data centres. These include Google's TPUs, Amazon's Trainium processors and Nvidia graphics processing units. The approach addresses capacity constraints in an industry where processing infrastructure remains limited. Datacentremagazine
This is NOT a single data center — Anthropic is running a distributed infrastructure strategy across:
Google Cloud TPUs: 1+ million chips, 1+ GW capacity
AWS Trainium: 500K-1M chips via Project Rainier
Nvidia GPUs: Deployed across multiple cloud providers
The Customer Growth Driving This Buildout
Anthropic now serves more than 300,000 business customers. Accounts paying over US$100,000 per year have grown nearly seven times in the past year, driving requirements for processing infrastructure. Datacentremagazine
Anthropic now serves 300,000+ business customers with Claude, and enterprise accounts make up roughly 80% of revenue. Anthropic's revenue is on track to hit $9 billion by year-end, with internal targets calling for $20-26 billion in 2026. Maginative
CEO's Vision: $100 Billion Training Clusters by 2027
Dario Amodei said, "So right now, I think most of the frontier model companies, I would guess, are operating in roughly $1 billion scale, plus or minus a factor of three. Those are the models that exist now or are being trained now. I think next year we're going to go to a few billion [dollars], and then 2026, we may go to above $10 billion. And probably by 2027, their ambition [is] to build $100 billion dollar clusters. And I think all of that actually will happen." Data Center Dynamics
That theoretical facility would span some 30 million square feet (2,787,100 sqm) and feature some two million GPUs. The single data center would be nearly as large as the combined footprint and capacity of AWS or Microsoft from just a year ago. Data Center Dynamics
The Latest TPU Generation: Ironwood (TPU v7)
Announced at its 2025 Next conference, Ironwood delivers 42.5 exaflops of compute per pod and contains more than 9,000 chips per unit, which Google describes as "more than 10x improvement" from its previous TPU generation. Datacentremagazine
Why This Makes Claude "Amazingly Valuable"
The scale you're looking at here is unprecedented:
Multi-gigawatt compute — More power than small cities
1+ million TPU chips + 500K-1M Trainium chips — This is the largest AI training infrastructure ever assembled by a single company outside of Google/Microsoft/Meta themselves
Multi-cloud resilience — No single vendor can shut them down or constrain capacity
$95+ billion total commitment — This exceeds the GDP of many countries
To put this in perspective relative to your earlier research: Anthropic alone is committing infrastructure on the scale of a significant fraction of the entire hyperscaler buildout. They're effectively building their own virtual "hyperscale cloud" distributed across AWS, Google Cloud, and others.
And if you don't believe me --download the Claude AI app and ask him yourself!
The Bottom Line:
Anthropic doesn't have "a data center" — they and most of their competitors for Claude Work have a distributed multi-gigawatt AI supercomputer spread across multiple continents, using over 1.5 million specialized AI chips (TPUs + Trainium + GPUs), with total commitments exceeding $95 billion.
This scale of infrastructure enables Claude to compete with GPT-4 while maintaining the quality you experience. The compute required to train and serve frontier models like Claude 4.5 Opus is measured in gigawatts, not megawatts — roughly the power consumption of powering hundreds of thousands of homes, running 24/7.
This directly ties into the silver, copper, and energy themes you've been tracking. Every one of those 1.5+ million chips needs silver for connections, copper for power delivery, massive cooling systems, and continuous gigawatt-scale power — multiplied across the entire glboal AI industry.
Rule #1: Don't let a one-day sell-off of EXTREMELY OVERBOUGHT AI Chips, AMD's imperfect guidance scare you out of the AI Revolution !
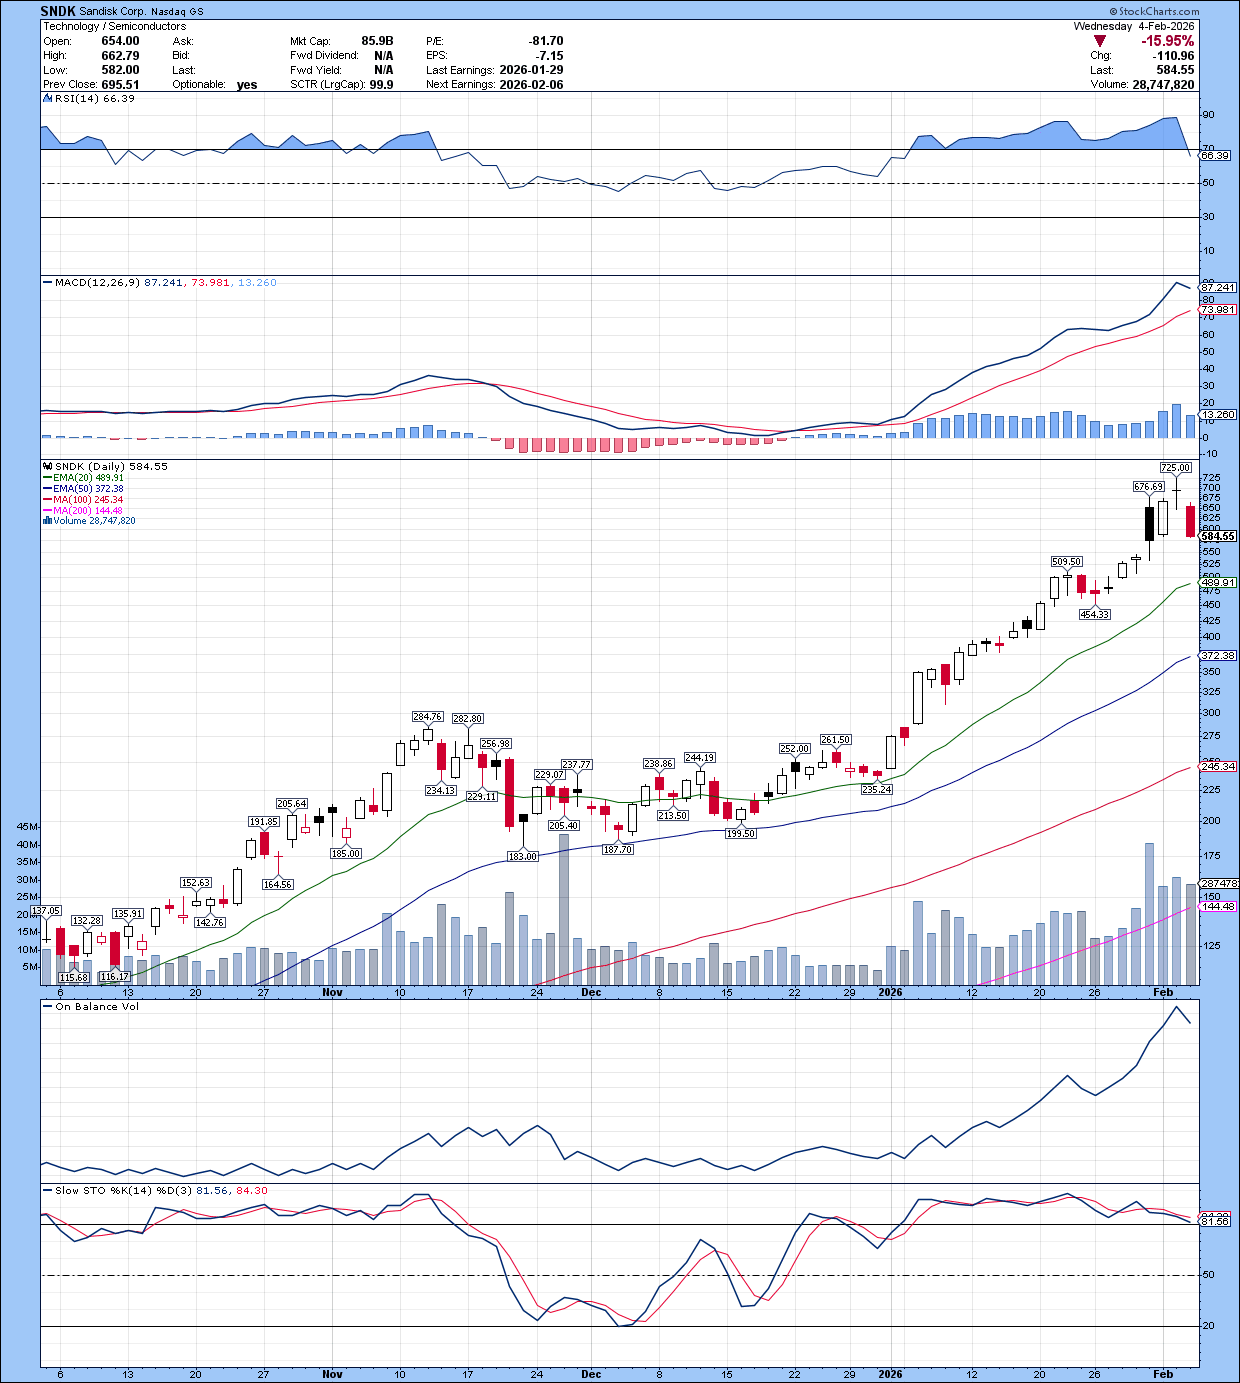
Rule #2: IF you own an AI Date Center chip or infrastructure stock like Sandisk that we added last week before earnings in the TR Trading Room and the chart goes straight up from $250 to $725--SELL IT !!
Need to raise some cash for new SupeCycle Stock? Take some long-term capital gains on our TR Ultra Growth Porfolio
| Company | Ticker | Investment Amount | Investment Date | Buy In Stock Price | Price on 2/4/2026 | Inv. Value 2/4/2026 | $ Gain | % Gain |
|---|---|---|---|---|---|---|---|---|
| Nvidia | NVDA | $10,000 | 5/15/23 | $29.00 | $174.19 | $60,067 | $50,067 | 501% |
| SuperMicro (Sold 1/24) | SMCI | $10,000 | 5/15/23 | $8.40 | $92.66 | $110,310 | $100,310 | 1003% |
| Applied Micro | AMD | $10,000 | 5/15/23 | $95.00 | $200.19 | $21,073 | $11,073 | 111% |
| Taiwan Semi | TSM | $10,000 | 5/15/23 | $83.50 | $325.67 | $39,002 | $29,002 | 290% |
| Broadcom | AVGO | $10,000 | 5/15/23 | $62.90 | $308.05 | $48,975 | $38,975 | 390% |
| Arista Networks | ANET | $10,000 | 5/15/23 | $34.25 | $130.38 | $38,067 | $28,067 | 281% |
| Pure Storage | PSTG | $10,000 | 5/15/23 | $33.20 | $67.28 | $20,265 | $10,265 | 103% |
| Uranium X ETF | URA | $10,000 | 5/15/23 | $21.90 | $52.35 | $23,904 | $13,904 | 139% |
| Centrus Energy | LEU | $10,000 | 5/15/23 | $31.90 | $251.64 | $78,882 | $68,882 | 689% |
| TQQQ | TQQQ | $10,000 | 5/15/23 | $28.70 | $49.76 | $17,338 | $7,338 | 73% |
| SOXL | SOXL | $10,000 | 5/15/23 | $14.70 | $53.19 | $36,180 | $26,180 | 262% |
| Vertiv | VRT | $10,000 | 5/15/23 | $25.30 | $182.62 | $72,182 | $62,182 | 622% |
| 3X Gold Miners | GDXU | $10,000 | 9/15/24 | $32.50 | $321.51 | $98,926 | $88,926 | 889% |
| 3X Junior Gold Miners | JNUG | $10,000 | 9/15/24 | $38.24 | $258.72 | $67,657 | $57,657 | 577% |
| AGQ | AGQ | $10,000 | 9/15/25 | $38.24 | $175.45 | $45,881 | $35,881 | 359% |
| Amplify Jr Silver Miners | SILJ | $10,000 | 9/15/25 | $21.18 | $33.47 | $15,803 | $5,803 | 58% |
FRIDAY: TR Ultra Growth Super Cycle Sector STOCKS & ETF BUY LISTS
P.S.: We are sharing this email with both current and former subscribers. IF you are NOT a subscriber who has crushed the SP 500 by 8X since May 2023 with our AI Data Center portfolio--you can subscribe for the next 12 months for less than $100--we are adding dozens of new Ultra Growth stocks and ETFs over the next year--subscribe here!!